Note
Go to the end to download the full example code.
Bethkenhagen et al. carbon-ionization comparison
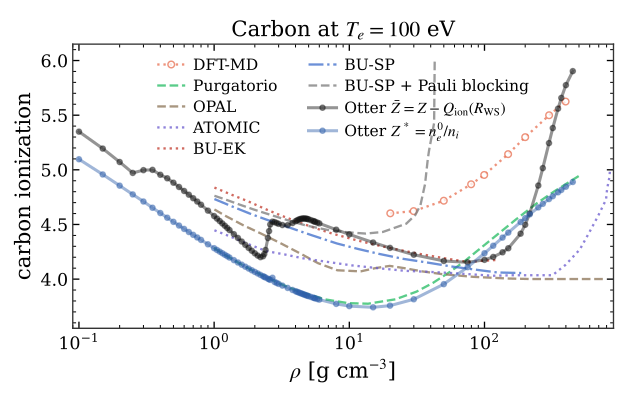
This benchmark compares Otter’s carbon ionization diagnostics at \(T_e=100\) eV with the model-dependent \(Z^{\rm free}\) curves in Figure 3(a) of Bethkenhagen et al. [2020].
This benchmark owns the full-AA density scan. Carbon ionization at 100 eV shares the resulting figure without repeating the calculation.
Otter reports \(\bar Z=Z-Q_{\rm ion}(R_{\rm WS})\) and \(Z^*=n_e^0/n_i\). The published curves use several different electron partitions, so no pointwise error metric is assigned.
Reproduction
From the root of the complete Otter checkout, using Poetry, run:
poetry run python benchmarks/examples/plot_bethkenhagen_et_al_2020_carbon_ionization.py
Downloads are optional: .ipynb launches this repository script; .zip
contains both formats. See Reproducing examples and benchmarks for setup.
The script calculates the states from their input parameters and then plots the results. No bundled Otter NPZ is required. Numerical outputs are written locally; literature reference tables remain inputs to the comparison.
Recorded results
The figures and output below are from the recorded validation run; running the source recalculates them with the installed Otter version.
Recorded terminal output
[computed] C, rho=0.15 g/cc
[computed] C, rho=0.1 g/cc
[computed] C, rho=0.2 g/cc
[computed] C, rho=0.25 g/cc
[computed] C, rho=0.3 g/cc
[computed] C, rho=0.4 g/cc
[computed] C, rho=0.45 g/cc
[computed] C, rho=0.5 g/cc
[computed] C, rho=0.55 g/cc
[computed] C, rho=0.6 g/cc
[computed] C, rho=0.65 g/cc
[computed] C, rho=0.7 g/cc
[computed] C, rho=0.75 g/cc
[computed] C, rho=0.8 g/cc
[computed] C, rho=0.9 g/cc
[computed] C, rho=1 g/cc
[computed] C, rho=1.05 g/cc
[computed] C, rho=1.1 g/cc
[computed] C, rho=1.15 g/cc
[computed] C, rho=1.2 g/cc
[computed] C, rho=1.25 g/cc
[computed] C, rho=1.3 g/cc
[computed] C, rho=1.4 g/cc
[computed] C, rho=1.5 g/cc
[computed] C, rho=1.6 g/cc
[computed] C, rho=1.7 g/cc
[computed] C, rho=1.8 g/cc
[computed] C, rho=1.9 g/cc
[computed] C, rho=2 g/cc
[computed] C, rho=2.1 g/cc
[computed] C, rho=2.2 g/cc
[computed] C, rho=2.3 g/cc
[computed] C, rho=2.35 g/cc
[computed] C, rho=2.4 g/cc
[computed] C, rho=2.5 g/cc
[computed] C, rho=2.55 g/cc
[computed] C, rho=2.6 g/cc
[computed] C, rho=2.7 g/cc
[computed] C, rho=2.8 g/cc
[computed] C, rho=2.9 g/cc
[computed] C, rho=3 g/cc
[computed] C, rho=3.2 g/cc
[computed] C, rho=3.5 g/cc
[computed] C, rho=3.8 g/cc
[computed] C, rho=4 g/cc
[computed] C, rho=4.1 g/cc
[computed] C, rho=4.2 g/cc
[computed] C, rho=4.3 g/cc
[computed] C, rho=4.4 g/cc
[computed] C, rho=4.5 g/cc
[computed] C, rho=4.6 g/cc
[computed] C, rho=4.7 g/cc
[computed] C, rho=4.8 g/cc
[computed] C, rho=4.9 g/cc
[computed] C, rho=5 g/cc
[computed] C, rho=5.2 g/cc
[computed] C, rho=5.4 g/cc
[computed] C, rho=5.5 g/cc
[computed] C, rho=0.35 g/cc
[computed] C, rho=5.6 g/cc
[computed] C, rho=5.8 g/cc
[computed] C, rho=6 g/cc
[computed] C, rho=10 g/cc
[computed] C, rho=8 g/cc
[computed] C, rho=15 g/cc
[computed] C, rho=20 g/cc
[computed] C, rho=30 g/cc
[computed] C, rho=50 g/cc
[computed] C, rho=75 g/cc
[computed] C, rho=100 g/cc
[computed] C, rho=116 g/cc
[computed] C, rho=136 g/cc
[computed] C, rho=150 g/cc
[computed] C, rho=185 g/cc
[computed] C, rho=200 g/cc
[computed] C, rho=216 g/cc
[computed] C, rho=250 g/cc
[computed] C, rho=270 g/cc
[computed] C, rho=300 g/cc
[computed] C, rho=320 g/cc
[computed] C, rho=350 g/cc
[computed] C, rho=370 g/cc
[computed] C, rho=400 g/cc
[computed] C, rho=450 g/cc
Otter calculation staged at benchmarks/outputs/carbon_ionization_levels/C_Te100eV_density_scan.npz: reused 0 accepted states; added 84 cached or newly calculated states; retained 0 nonconverged audit record(s).
Loaded 7 digitized curves from Bethkenhagen et al. (2020), Fig. 3(a).
from __future__ import annotations

import hashlib
import json
import os
import importlib.util
import sys
from pathlib import Path

import matplotlib.pyplot as plt
import numpy as np

from otter.plotting import PALETTES, grid_figsize, save_figure, style_context


# =============================================================================
# User input
# =============================================================================
USE_ACCEPTED_OTTER_SCAN = False
RECOMPUTE_WITH_OTTER = True
if os.environ.get("OTTER_USE_CANDIDATE_CARBON_IONIZATION", "0") == "1":
    USE_ACCEPTED_OTTER_SCAN = False
# =============================================================================


STATE_SCHEMA = "otter_carbon_ionization_levels_v3"


def repository_root() -> Path:
    """Locate source and reference inputs, independently of numerical outputs."""
    candidates = [Path.cwd().resolve(), *Path.cwd().resolve().parents]
    source_file = globals().get("__file__")
    if source_file is not None:
        candidates.extend(Path(source_file).resolve().parents)
    for candidate in candidates:
        if (candidate / "pyproject.toml").is_file() and (candidate / "src/otter").is_dir():
            return candidate
    raise FileNotFoundError("Run from an Otter source checkout with its dependencies installed.")


ROOT = repository_root()
BASELINE_DIR = ROOT / "benchmarks" / "baselines" / "carbon_ionization_levels"
CANDIDATE_DIR = ROOT / "benchmarks" / "outputs" / "carbon_ionization_levels"
REFERENCE_DIR = (
    ROOT
    / "benchmarks"
    / "reference_data"
    / "bethkenhagen_et_al_2020_carbon_ionization"
)
FIGURE_DIR = (
    ROOT
    / "benchmarks"
    / "outputs"
    / "bethkenhagen_et_al_2020_carbon_ionization"
    / "figures"
)
DATA_FILENAME = "C_Te100eV_density_scan.npz"


def sha256_file(path: Path) -> str:
    """Return the SHA-256 digest of one file."""
    digest = hashlib.sha256()
    with path.open("rb") as stream:
        for block in iter(lambda: stream.read(1024 * 1024), b""):
            digest.update(block)
    return digest.hexdigest()


def load_otter_scan(*, accepted: bool) -> dict[str, np.ndarray]:
    """Verify and load the shared carbon-ionization scan."""
    directory = BASELINE_DIR if accepted else CANDIDATE_DIR
    data_path = directory / DATA_FILENAME
    manifest_path = data_path.with_name("manifest.json") if accepted else data_path.with_suffix(".manifest.json")
    if not data_path.is_file() or not manifest_path.is_file():
        if accepted:
            raise FileNotFoundError("The accepted carbon-ionization scan is missing.")
        raise FileNotFoundError(
            "The carbon-ionization candidate is missing. Run "
            "benchmarks/examples/plot_bethkenhagen_et_al_2020_carbon_ionization.py with "
            "RECOMPUTE_WITH_OTTER=True first."
        )

    manifest = json.loads(manifest_path.read_text(encoding="utf-8"))
    expected_schema = (
        "otter_example_manifest_v1" if accepted else "otter_gallery_manifest_v1"
    )
    expected_status = "accepted" if accepted else "candidate_not_accepted"
    if (
        manifest.get("schema_version") != expected_schema
        or manifest.get("example_id") != "carbon_ionization_levels"
        or not str(manifest.get("status", "")).startswith(expected_status)
    ):
        raise ValueError("Unexpected carbon-ionization manifest.")
    record = dict(manifest.get("state", {}))
    if record.get("data_file") != data_path.name:
        raise ValueError("The carbon-ionization manifest names the wrong file.")
    if sha256_file(data_path) != str(record.get("data_sha256")):
        raise RuntimeError("Carbon-ionization scan checksum mismatch.")

    with np.load(data_path, allow_pickle=False) as archive:
        state = {key: np.asarray(archive[key]) for key in archive.files}
    if str(state["schema_version"].item()) != STATE_SCHEMA:
        raise ValueError("Unsupported carbon-ionization data schema.")
    if not np.all(np.asarray(state["stage2_converged"], dtype=bool)):
        raise RuntimeError("The carbon-ionization scan contains an unconverged state.")
    if np.asarray(state.get("failed_rho_g_cc", ()), dtype=float).size:
        raise RuntimeError("The carbon-ionization scan contains failed states.")
    if not np.isclose(float(np.asarray(state["temperature_ev"]).item()), 100.0):
        raise ValueError("The shared scan is not the requested 100 eV state.")
    print(f"Using {'accepted' if accepted else 'candidate'} Otter scan: {data_path.relative_to(ROOT)}")
    return state


def load_published_curves() -> dict[str, tuple[np.ndarray, np.ndarray]]:
    """Load the checksummed digitization of published Figure 3(a)."""
    manifest_path = REFERENCE_DIR / "manifest.json"
    manifest = json.loads(manifest_path.read_text(encoding="utf-8"))
    if (
        manifest.get("schema_version") != "otter_reference_manifest_v1"
        or manifest.get("dataset_id")
        != "bethkenhagen_et_al_2020_carbon_ionization"
        or str(manifest["source"]["doi"])
        != "10.1103/PhysRevResearch.2.023260"
    ):
        raise ValueError("Unexpected Bethkenhagen et al. reference manifest.")

    curves: dict[str, tuple[np.ndarray, np.ndarray]] = {}
    for record in manifest["files"]:
        path = REFERENCE_DIR / str(record["file"])
        if sha256_file(path) != str(record["sha256"]):
            raise RuntimeError(f"Reference checksum mismatch: {path.name}.")
        values = np.loadtxt(path, delimiter=",", comments="#")
        if (
            values.ndim != 2
            or values.shape[1] != 2
            or np.any(~np.isfinite(values))
            or np.any(values[:, 0] <= 0.0)
            or np.any(np.diff(values[:, 0]) <= 0.0)
        ):
            raise ValueError(f"Malformed reference curve: {path.name}.")
        curves[str(record["label"])] = (values[:, 0], values[:, 1])
    return curves


def plot_comparison(
    state: dict[str, np.ndarray],
    published: dict[str, tuple[np.ndarray, np.ndarray]],
) -> None:
    """Plot Otter and published ionization diagnostics."""
    rho = np.asarray(state["rho_g_cc"], dtype=float)
    colors = PALETTES["bing"]
    styles = {
        "DFT-MD": (colors[2], ":", "o"),
        "Purgatorio": (colors[3], "--", None),
        "OPAL": (colors[4], "--", None),
        "ATOMIC": (colors[5], ":", None),
        "BU-EK": (colors[6], ":", None),
        "BU-SP": (colors[7], "-.", None),
        "BU-SP + Pauli blocking": ("0.48", "--", None),
    }

    with style_context("thesis", palette="bing"):
        fig, ax = plt.subplots(figsize=grid_figsize(1, 1))
        for label, (rho_ref, z_ref) in published.items():
            color, line_style, marker = styles[label]
            ax.plot(
                rho_ref,
                z_ref,
                color=color,
                ls=line_style,
                lw=1.75,
                marker=marker,
                ms=5.0 if marker else None,
                markerfacecolor="white" if marker else None,
                markeredgewidth=1.1 if marker else None,
                alpha=0.75,
                label=label,
            )
        ax.plot(
            rho,
            np.asarray(state["zbar"], dtype=float),
            color="#131313",
            lw=2.3,
            marker="o",
            ms=4.0,
            alpha=0.45,
            label=r"Otter $\bar Z=Z-Q_{\rm ion}(R_{\rm WS})$",
        )
        ax.plot(
            rho,
            np.asarray(state["zstar"], dtype=float),
            color=colors[1],
            lw=2.3,
            marker="o",
            ms=4.0,
            alpha=0.45,
            label=r"Otter $Z^*=n_e^0/n_i$",
        )
        ax.set(
            xscale="log",
            xlim=(0.09, 900.0),
            ylim=(3.55, 6.15),
            xlabel=r"$\rho$ [g cm$^{-3}$]",
            ylabel="carbon ionization",
            title=r"Carbon at $T_e=100$ eV",
        )
        ax.legend(ncol=2, fontsize="small", loc="best")
        fig.tight_layout()
        paths = save_figure(
            fig,
            FIGURE_DIR / "bethkenhagen_2020_carbon_ionization",
        )
    print(f"saved PNG: {paths['png'].relative_to(ROOT)}")
    print(f"saved PDF: {paths['pdf'].relative_to(ROOT)}")
    plt.show()


def main() -> None:
    """Calculate the shared scan and render the literature comparison."""
    if RECOMPUTE_WITH_OTTER:
        path = ROOT / "benchmarks/runners/regenerate_carbon_ionization_levels.py"
        spec = importlib.util.spec_from_file_location("otter_carbon_scan", path)
        module = importlib.util.module_from_spec(spec)
        sys.modules[spec.name] = module
        spec.loader.exec_module(module)
        state = module._compute_and_stage()
    else:
        state = load_otter_scan(accepted=USE_ACCEPTED_OTTER_SCAN)
    published = load_published_curves()
    print(
        f"Loaded {len(published)} digitized curves from "
        "Bethkenhagen et al. (2020), Fig. 3(a)."
    )
    plot_comparison(state, published)


if __name__ == "__main__":
    main()